How to Read Your Google Search Console Performance Report: A Guide for Business Owners
Google Search Console is the one place Google tells you, in its own numbers, how people find your website through search. Yet most business owners open the Performance report, see four figures and a line chart, and close it again without knowing what to do next.
This guide walks through what each number means, how to slice the report to find real opportunities, and the handful of habits that turn it into a monthly to-do list rather than a screen you glance at.
Where to find it
In Search Console, open Performance → Search results. It shows how your site appeared in Google Search over the date range at the top — the last three months by default, and up to 16 months back. The data usually lags by a couple of days, so today's clicks won't be there yet.
The four numbers at the top
- Total clicks: how many times someone clicked through from Google Search to your site.
- Total impressions: how many times a link to your site appeared in someone's search results. An impression doesn't mean they noticed it — only that it was there.
- Average CTR (click-through rate): clicks divided by impressions. It tells you how often being seen turned into a visit.
- Average position: where your site typically ranked, based on the highest position it appeared at for each search. Lower is better — position 1 is the top result.
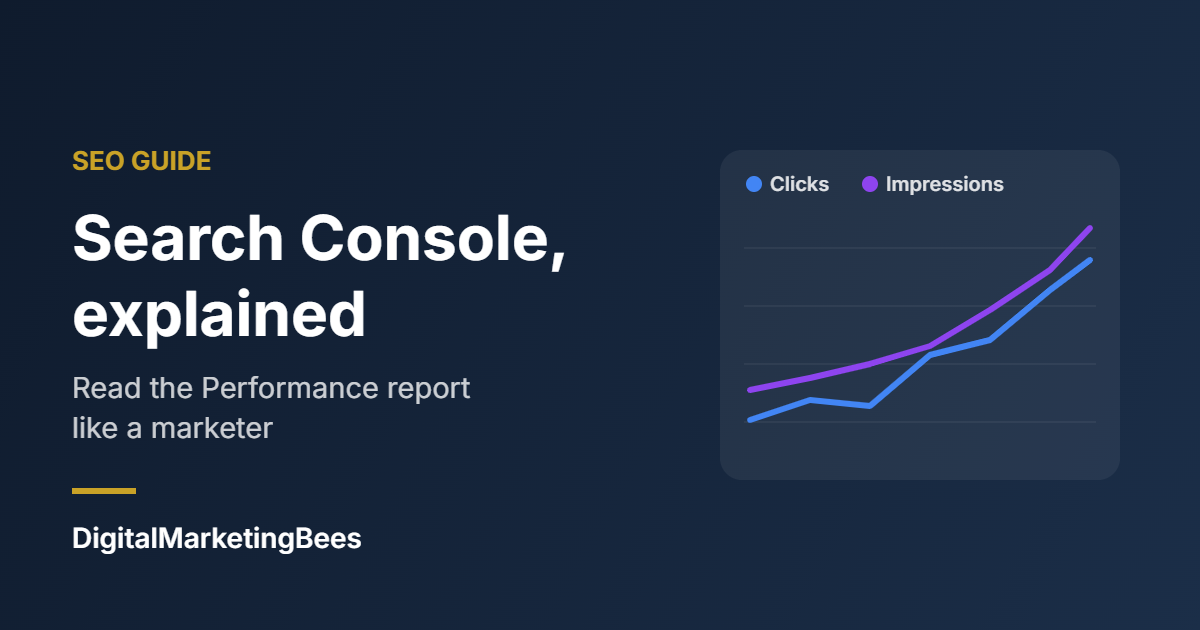
Click each box to add it to the chart. Seeing clicks and impressions together is the quickest way to tell whether a drop in traffic came from fewer searches (impressions fell) or fewer people choosing you (CTR fell).
The tabs that do the real work
Below the chart, the report breaks the same numbers down several ways:
- Queries: the searches people typed when your site appeared. Google hides some rare queries to protect searchers' privacy, so these rows won't always add up to the total.
- Pages: which of your pages appeared and earned the clicks.
- Countries and Devices: where searchers were and whether they were on mobile, desktop or tablet.
- Search appearance and Dates: special result types your site earned, and the day-by-day numbers.
Click any row to filter the whole report by it. Click a page, then switch to the Queries tab, and you'll see exactly which searches that page shows up for.
Four ways to find opportunities
1. Lots of impressions, few clicks
Sort queries by impressions and look for ones with a low CTR. Google is already showing your page — people just aren't choosing it. Rewrite that page's title and meta description so they answer the search more directly and give a reason to click.
2. Pages sitting just off the top
Queries where your average position is between roughly 5 and 20 are within reach. The page is relevant; it needs to be more useful. Expand the section that answers the query, add a clear heading for it, and link to the page from related pages on your site.
3. Pages that are slipping
Use Compare in the date filter — this month against last month, or against the same period last year for seasonal businesses. Sort pages by the change in clicks. For each page that dropped, check whether impressions fell (fewer people searching, or you slipped in rankings) or CTR fell (a competitor's listing became more attractive).
4. Brand versus non-brand searches
Add a query filter that excludes your business name. What's left is how new customers find you — usually the number that matters most for growth, and one that brand searches can easily hide.
Common misreadings
- "Average position went down, so things got worse." Not necessarily. Showing up for more searches — including new ones where you rank lower — can pull the average down while clicks go up.
- "The numbers don't match Google Analytics." They measure different things. Search Console counts clicks from Google Search results; Analytics counts sessions on your site from every source, and each tool processes data differently.
- "Impressions spiked — we're going viral." A sudden jump can simply mean Google is testing your page for new searches, often in low positions. Watch whether clicks follow.
A simple monthly routine
Once a month: compare the last 28 days with the 28 before, note the pages that gained and lost clicks, pick two high-impression, low-CTR queries to improve titles for, and pick one page ranking just off the top to strengthen. Small, regular improvements add up faster than an occasional overhaul.
See it in your DMB-One dashboard
You can do all of this in Google Search Console itself. If you use DMB-One, connect Google Search Console under Connections and pick your site: your clicks, impressions, CTR, average position and top queries appear in your dashboard next to your other marketing data, so the monthly review starts from one screen.