Google Analytics 4 for Business Owners: The Reports That Actually Matter
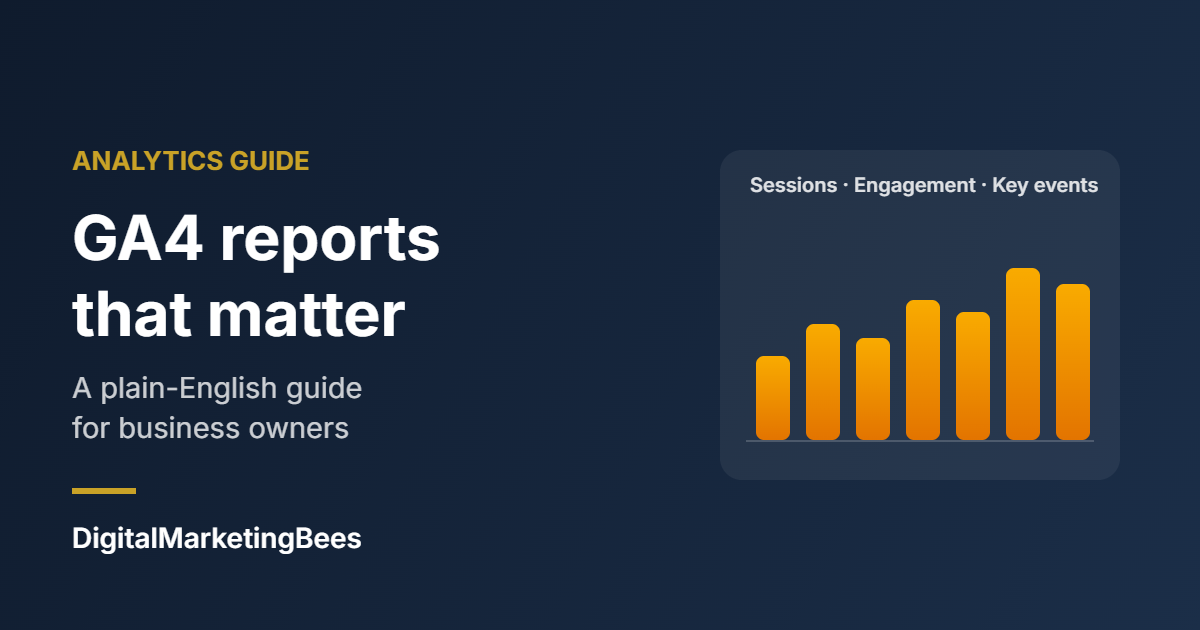
Google Analytics 4 can tell you almost anything about your website visitors — which is exactly why so many business owners find it overwhelming. Dozens of reports, unfamiliar terms, and numbers that don't match the old Universal Analytics you might remember.
You don't need most of it. This guide covers the handful of GA4 reports and metrics that answer the questions a business actually asks: where are visitors coming from, what are they looking at, and are they doing what we want?
First, the words GA4 uses
GA4 measures things differently from the Universal Analytics it replaced in 2023, so a few terms are worth getting straight before you open any report.
- Users: the number of people who visited. In most standard reports, "Users" means active users. One person on two devices can count twice.
- Sessions: visits. One user can have several sessions over a week.
- Engaged session: a visit that lasted longer than 10 seconds, viewed two or more pages, or completed a key event. It is GA4's way of separating real visits from people who arrived and left.
- Engagement rate: engaged sessions as a share of all sessions. GA4's bounce rate is simply the opposite of this.
- Views: page views — how many times your pages were loaded.
- Key events: the actions that matter to your business, such as a form submission, a call-button tap or a purchase. Google renamed "conversions" to "key events" in 2024.
Report 1: Where your visitors come from
Open Reports → Acquisition → Traffic acquisition. It groups sessions by channel: Organic Search, Direct, Paid Search, Organic Social, Referral, Email and so on.
Look at more than the session count. Compare the engagement rate and key events for each channel. A channel that sends fewer visits but more enquiries often deserves more of your time and budget than the one with the biggest number.
Two things commonly distort this report. Direct includes any visit GA4 can't attribute — links in PDFs, some apps and messaging tools — so it is rarely just people typing your address. And Unassigned means GA4 couldn't match the traffic to a channel, which usually points to campaign links tagged inconsistently.
Report 2: Which pages people land on
Open Reports → Engagement → Landing page. This shows the first page of each visit — in effect, your real front doors, which are often blog posts or service pages rather than your home page.
Sort by sessions, then check each top landing page's engagement rate. A page that attracts plenty of visitors but has a low engagement rate is a leak worth fixing: its headline may not match what people expected, it may load slowly, or it may not tell visitors what to do next.
Report 3: What they look at
Reports → Engagement → Pages and screens ranks every page by views, with average engagement time alongside. Use it to see which content holds attention and which gets skimmed. Pages with high views and long engagement time are your strongest material — link to them from elsewhere on your site and build more like them.
Report 4: Whether they take action
Traffic only matters if it leads somewhere. In Admin → Data display → Events, mark the events that represent real outcomes — a submitted enquiry form, a booking, a purchase — as key events. From then on, every report above can show which channels and pages produce them.
If you skip this step, GA4 can tell you how many people visited but not whether your website is doing its job. It is the single most valuable ten minutes you can spend in GA4.
Report 5: Mobile or desktop
Reports → Tech → Tech overview breaks visits down by device category. If most of your visitors are on phones but most of your key events come from desktop, your mobile experience is probably getting in the way — forms that are hard to fill in, buttons that are hard to tap, or pages that load slowly on a phone connection.
Make your campaigns measurable
When you share a link in an email, a social post or an ad, add UTM parameters — utm_source, utm_medium and utm_campaign — so GA4 knows where each visit came from. Keep the naming consistent (always "newsletter", never a mix of "Newsletter" and "email-news"), and those visits will stop disappearing into Direct or Unassigned.
Common misreadings
- "GA4 doesn't match our old numbers." It counts sessions and users differently from Universal Analytics, so a straight comparison with pre-2023 figures isn't meaningful. Compare GA4 against GA4.
- "GA4 doesn't match Search Console." Search Console counts clicks from Google Search results; GA4 counts sessions from every source, and some visitors decline analytics cookies. The two will never match exactly.
- "Sessions went up, so we're doing better." Only if engagement and key events went up too. More low-quality visits can make every other number worse.
A monthly ten-minute check
Once a month, compare the last 28 days with the 28 before: which channels grew, which landing pages lost engagement, and whether key events moved in the same direction as traffic. Write down one thing to fix and one thing to do more of. That habit beats any dashboard you never open.
See it in your DMB-One dashboard
You can run all of these reports in Google Analytics itself. If you use DMB-One, connect Google Analytics under Connections and choose your GA4 property: your sessions, users, page views, daily trend and top pages appear in your dashboard alongside your search and social data, so your monthly check starts from one place.